
Microsoft 365 Platform Services
A New Way to Work
The digital revolution is not only inevitable; it is here. Advancements in software, hardware and connectivity have made it possible to reimagine how employees, customers, partners and applications connect. But the right digital collaboration approach requires the right partner.
Thrive brings its expertise in leading digital collaboration platforms like Microsoft 365, SharePoint and Microsoft Teams to create best-in-class managed solutions tailored to your needs. Your business will benefit from improved communications, greater efficiency and better decision-making.
Ready to Speak with Our Experts?
A Proven Methodology
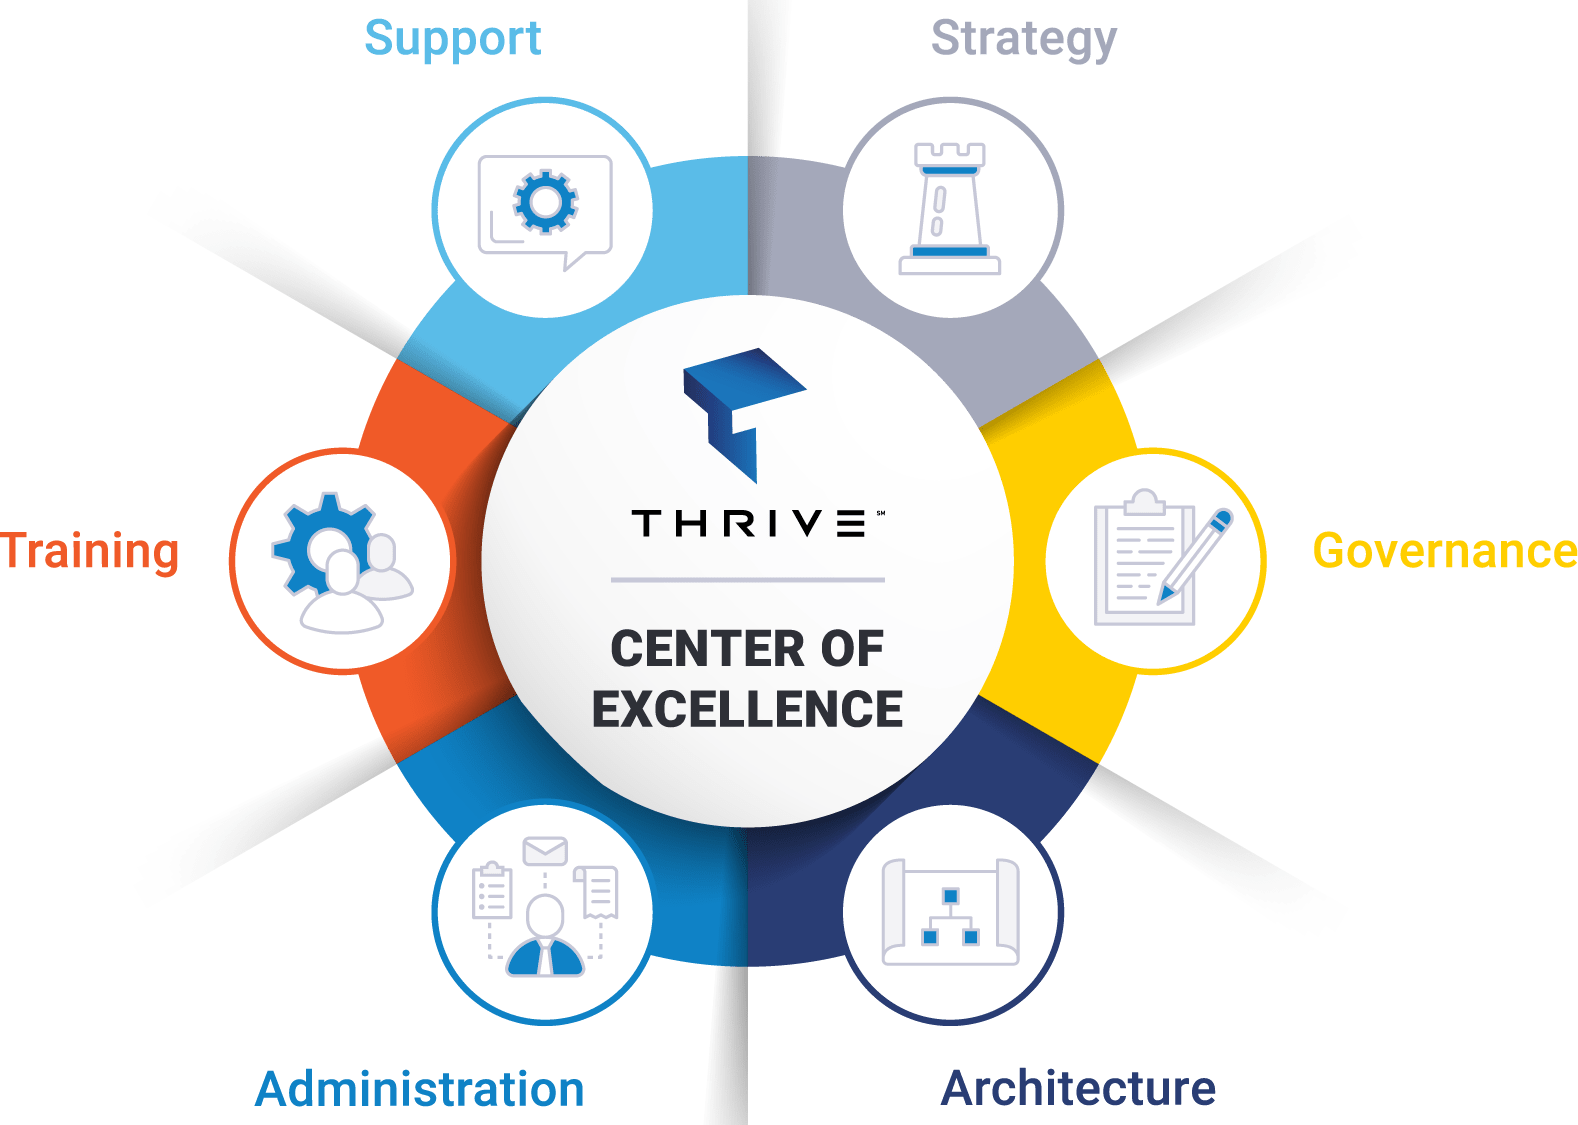
Our approach to the managed support of your Microsoft 365 Platform collaboration services is different. We employ a more holistic, Center of Excellence (CoE) methodology.
- We begin with your strategy. We document your business and operational goals and identify the technology needed from the Microsoft 365 platform to achieve them. We also define the associated governance and architecture required.
- We then deliver the appropriate training, administration, and support.
- At the center, our unique approach to communication and collaboration bring all pillars together.
- We repeat the process as business needs evolve and/or new technologies emerge.
Microsoft 365 Platform Solutions
The time is now to be a digital business. Only Thrive offers the knowledge, service and dedication to deliver a fully managed solution that solves business challenges and unlocks new opportunities for growth and improvement.


Managed Office 365
Making the move to the latest cloud-based technology requires more than just technical expertise. That’s why Thrive focuses on driving adoption with end users, ensuring your investment creates a positive impact.
The Thrive team consists of experts in Office 365 and its core applications and capabilities, and prides itself on exceptional service delivery.
SharePoint
Thrive offers both fully-managed SharePoint solutions that span strategy, setup and support as well as targeted engagements for on-premise SharePoint environments to achieve specific collaboration, business process or operational goals.


Teams
Thrive brings deep expertise in Microsoft Teams to its clients, enabling them to deploy secure collaboration for an increasing virtual and distributed workforce.
The Thrive team helps companies set up, roll out, and optimize Teams with governance, implementation and training services that maximize ROI and user satisfaction.
Power Platform
Thrive streamlines and automates time-consuming processes through the use of the Microsoft Power Platform.
The Microsoft Power Platform combines the capabilities of Power Apps, Power BI and Power Automate (Microsoft Flow) into a business application building powerhouse.

Ready To Deliver Digital Excellence
When you’re ready to discuss your digital collaboration goals using Microsoft 365 Platform Services, contact the Thrive team for an in-depth look at how our solutions solve your challenges.